Professional coffee roasting| Is the natural curve of baked beans coincidence or science?
For professional baristas, please follow the coffee workshop (Wechat official account cafe_style)
Using the open source free baking recording software Artisan not only allows us to focus on the process of baking beans, but also adds a lot of unexpected ideas, or fun. I don't understand why people are so resistant to it.
At the end of the page of the 2015 SCAE Baking Competition in Germany, there is a graph of the champion Alec. That's what the page says.
Oh, and Alec, the winner, came up with an almost perfect Natural Roast up to FCs. Nice!
Our winner Alec ran an almost perfect baking natural curve until the explosion began.
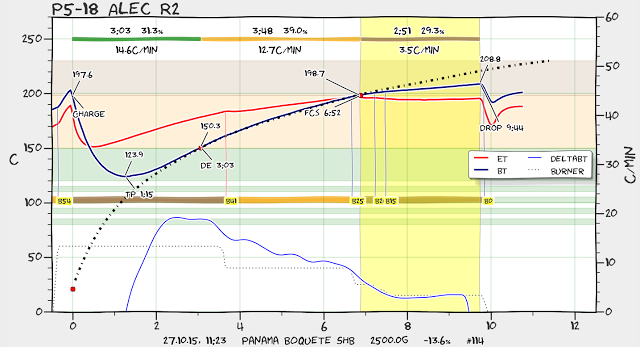
The black dotted line above is Nature Roast Curve (the natural curve of baked beans). Before explaining what is the natural curve of baked beans, let's take a look at an interesting piece of literature. The interesting reason is that I can't read the content either, not just because it is written in English, but a major in chemistry, but it's good to watch the fun.
The process of baking beans is a series of chemical reactions, and this paper is called "Chemical Kinetics" chemical kinetics, also known as reaction kinetics, its function is to state the rate of change of reactants and products in the chemical reaction process. If substance A passes through a certain chemical reaction to form substance B, the number of A will become less and less with the reaction time, and on the contrary, it will become more and more. The relationship between the disappearance of An and B and the amount produced and the chemical reaction time will be graphed.
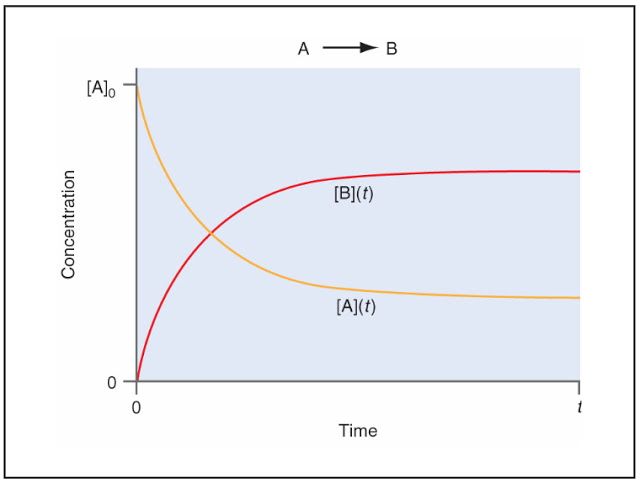
Take the red curve [B] above and compare it with the champion curve of Alec, do you find that the natural curve of baked beans represented by black dotted line is very similar? [B] the curve is the natural curve of the chemical reaction product, which coincides with the natural logarithmic curve ln ().
Does this comparison make sense? Does it mean that the natural curve is highly consistent with the natural curve, which means that his baking quality is better, or that the natural curve can be used as an important reference for our review afterwards?
Marko Luther, the creator of the Artisan software, explained on Blogger why he added the natural logarithm curve to Artisan v.0.9.8, saying it at the beginning.
People typically talk about the art of coffee roasting. We're interested in the science. Therefore, we keep adding features to Artisan that allow to analyze and compare roasts.
People always talk about the art of coffee roasting, and our interest is science, so we continue to add functions that can be used to analyze and compare each baking to Artisan.
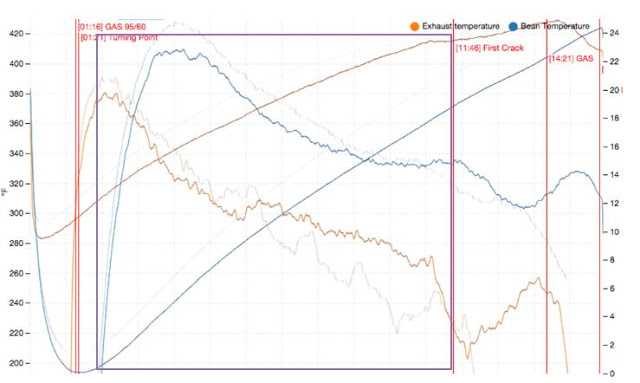
When baking in a fixed wind fire, the bean temperature and RoR curve will look like this (blue curve below)
Scott Rao emphasizes the phenomenon of Crash/Flick in RoR after an explosion. If you use the natural baking curve to deduce, when the bean temperature follows the natural logarithmic curve, its RoR slides smoothly to the right, as shown in the following figure (figure illustrated by Artisan)
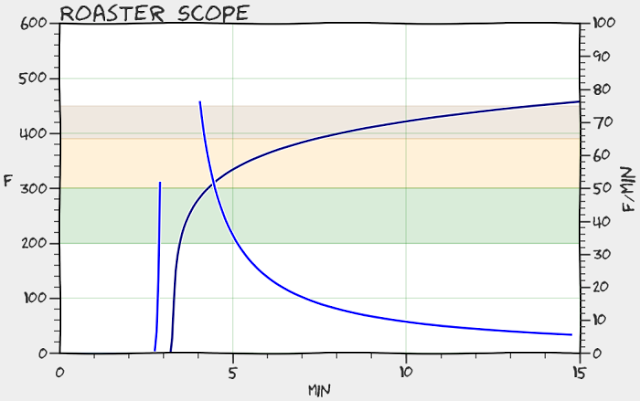
Is it almost the same as the chemical kinetic diagram above? Is this an interesting coincidence, or is it something else?
Let's take a look back at Alec's curve, he didn't throw the bean into the baking machine and let it conduct a high-temperature chemical reaction on its own, and then when the time was up, the cooked beans with excellent flavor could win the championship, especially after the explosion began, the bean temperature deviated downward from the natural curve of baked beans, because what we wanted was the flavor of beans, not a super-perfect curve that seemed to match the theory completely.
It is not known whether Scott Rao's emphasis on RoR, which slopes gently to the right, is based on chemical kinetics, but now it seems that the two are so cleverly matched. In fact, Artisan's Blogger also reveals a message, which I personally agree with, that is, what Scott Rao advocates is actually the baking rhythm of FSSF (Fast Start Slow Finish). This rhythm with his more frequently operated roaster supports his two most important arguments: RoR, which slopes gently to the right and has no Crash/Flick phenomenon, and DTR 2025% is the best. If the above premises are quite different from yours, then you can put aside what Scott advocates so that you won't cause trouble or tie your head all the time.
Artisan how to draw a natural logarithmic curve, please refer to the instructions on Blogger, because according to its method, I can only temporarily simulate, can not combine it with the original curve, do not dare to teach you a lesson and say to show you reference.
The following picture is I find a pot of my own curve, in Artisan to generate a natural logarithmic curve and its inverse function curve (different shades of purple thin lines, afraid to be associated with color, I first declare that it has nothing to do with seafood), one stick to bean temperature, one and RoR look around, it is interesting, but for now it is only interesting. Just look at the curve, this pot is really good baking, .

FrontStreet Coffee is a long-established specialty coffee roaster in Guangzhou China, selling freshly roasted beans from its own farm in Yunnan as well as dozens of carefully selected single-origin beans from around the world for both pour-over and espresso. The products deliver consistently excellent quality and great value, with shipping within 24 hours. Guangzhou’s FrontStreet Coffee shop is recommended by many coffee lovers, and the beans are now available online at the Tmall 。
Important Notice :
前街咖啡 FrontStreet Coffee has moved to new addredd:
FrontStreet Coffee Address: 315,Donghua East Road,GuangZhou
Tel:020 38364473

- Prev
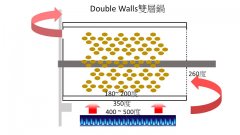
Professional coffee roasting | comparison of the effect of double-layer pot and single-layer pot
Communication of professional baristas Please pay attention to the coffee workshop (Wechat official account cafe_style). Due to the reason, I saw a manuscript. As I had no relevant background, I could only believe that what it described was true. I drew it in order to find out the difference and explore whether the operation surface can compensate for the fundamental difference in the structural plane. This is an excellent semi-hot fan with double baking barrel body.
- Next
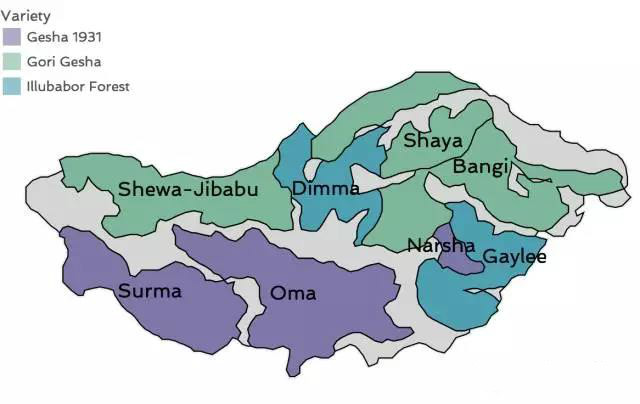
The history of the development of Zuoxia Village-what is the difference between Di Roxia Village and ordinary Ethiopian manors?
In 1931, a team of botanists visited southern Ethiopia and found a species of rose beans near the village of Gesha, with tall trees and larger seeds than ordinary Ethiopian beans. They took the seeds to Kenya, planted them in nurseries and grew up five years later. They took the fruits from the healthiest samples and brought them to Uganda and Tanzania. one hundred and ninety five
Related
- Beginners will see the "Coffee pull flower" guide!
- What is the difference between ice blog purified milk and ordinary milk coffee?
- Why is the Philippines the largest producer of crops in Liberia?
- For coffee extraction, should the fine powder be retained?
- How does extracted espresso fill pressed powder? How much strength does it take to press the powder?
- How to make jasmine cold extract coffee? Is the jasmine + latte good?
- Will this little toy really make the coffee taste better? How does Lily Drip affect coffee extraction?
- Will the action of slapping the filter cup also affect coffee extraction?
- What's the difference between powder-to-water ratio and powder-to-liquid ratio?
- What is the Ethiopian local species? What does it have to do with Heirloom native species?