
"Map"
1889 article(s) found

What do you think of the coffee baking curve-Starbucks baking curve HD map
What do you think of the coffee baking curve-Starbucks roasting curve HD map the coffee taste performance under the best roasting curve generally shows what the best taste state of this kind of coffee looks like. The evaluation obtained after careful cup testing can be used as a criterion for the taste of coffee. And as we said, the most important thing before baking is to know what kind of coffee you want to taste.

Brazilian Coffee planting time Base Map Flavor description introduction to Variety treatment in producing areas
Brazilian Coffee planting time Base Map Flavor description Variety treatment of producing areas introduction to the Great Economic crisis in 1929 the world consumption of coffee plummeted, which dealt a heavy blow to the Brazilian coffee plantation economy. Since then, the proportion of Brazilian coffee production in export earnings has plummeted. In the past 30 years, with the development of modern Brazilian industry, especially steel, shipbuilding, automobile and aircraft manufacturing,

Brazil mojiana coffee beans planting base map characteristics grinding scale processing method variety introduction
Coffee was first introduced to Brazil in the early 18th century. In 1727, the Brazilian government sent a handsome army officer to secretly bring coffee seeds back to Brazil from French Guiana on the grounds of mediating border disputes. It is said that the wife of the governor of French Guiana was deeply fascinated by this officer. Therefore, in 1727, the Brazilian government sent a handsome army officer to secretly bring coffee seeds back to Brazil.

Quality specification of Brazilian Santos coffee beans planting base map characteristic brand
The quality specification of Brazilian Santos coffee beans planting base map features the rich taste of the brand extends slowly on the tongue, completely sweeping the entire taste, and lasted for dozens of minutes. 1. Palate: slightly sweet with soft acidity, sweetness has its unique round ripe taste, its unique sweet, sour, bitter taste is extremely elegant. two。 Bouquet: intense aromas of fruit and grass. 3. Vision

Characteristics of taste distribution map of Panamanian coffee beans
Panamanian coffee bean processing characteristics Panama has been among the best coffee producers in the world since three years ago, which has surprised countries that have been in the vanguard of developer production for many years. Panamanian coffee is mainly produced in the west near the Costa Rican border, producing the best washed coffee. Compared with coffee beans grown at low and middle elevations
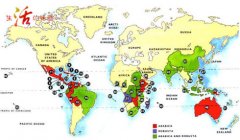
Map of Global Coffee producing areas
1. Costa Rica Costa Rica 2. Cuba Cuba 3. Dominican Republic Dominican Republic 4. Ei Salvador El Salvador 5. Guadeloupe Guadeloupe 6. Guatemala Guatemala 7. Haiti Haiti 8. Honduras Honduras 9. Jamaica Jamaica 10. Martinique Martinique 11. Mexico Mosi
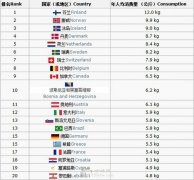
Coffee consumption map
This is a list of the top 20 countries that consume coffee per capita each year. The figure is 2008 or earlier. Global production is 7358897 tons, so the world averages 1.3kg per person per year.

The World Map of Fine Coffee beans-Asia
1. China (coffee production in China is mainly in Yunnan, Hainan and Taiwan. At present, Yunnan Province accounts for 70% of the country's coffee planting area and 83% of the country's output. Yunnan coffee has established its dominant position in China in terms of both planting area and coffee bean production.) 2. India 3, Indonesia 4, Yemen 5, Vietnam (responsibility
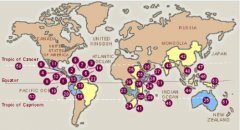


Boutique Coffee the taste map of tasting coffee
With regard to taste maps, coffee and red wine are often used in tasting. Taste refers to the ability to sense the taste of substances, including the taste of food, certain minerals and toxic substances, which is close to the sense of smell, which is also chemically induced. Western experts have traditionally believed that taste consists of four basic flavors: sweet, salty, sour and bitter.
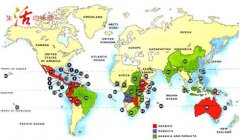
Map of global coffee producing area for the production of boutique coffee beans
Coffee trees grow in tropical or subtropical agricultural gardens centered around the equator and called coffee belts. Most of the coffee production is between the Tropic of Cancer, 25 degrees north of the tropical or subtropical equator and 30 degrees south of the equator. An area with an annual average temperature of 16-25 degrees Celsius, no Frosts Descent and rainfall of 1600-2000 mm.

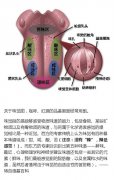
Basic knowledge of sensory training of coffee tasting map of tongue taste area
With regard to taste maps, coffee and red wine are often used in tasting. Taste refers to the ability to sense the taste of substances, including the taste of food, certain minerals and toxic substances, which is close to the sense of smell, which is also chemically induced. Western experts have traditionally believed that taste consists of four basic flavors: sweet, salty, sour and bitter.
Global coffee producing area map coffee bean producing area
1. Costa Rica Costa Rica 2. Cuba Cuba 3. Dominican Republic Dominican Republic 4. Ei Salvador El Salvador 5. Guadeloupe Guadeloupe 6. Guatemala Guatemala 7. Haiti Haiti 8. Honduras Honduras 9. Jamaica Jamaica 10. Martinique Martinique 11. Mexico Mosi

Basic knowledge of Coffee training Global Coffee producing area Map
Coffee trees grow in tropical or subtropical agricultural gardens centered around the equator and called coffee belts. Most of the coffee production is between the Tropic of Cancer, 25 degrees north of the tropical or subtropical equator and 30 degrees south of the equator. An area with an annual average temperature of 16-25 degrees Celsius, no Frosts Descent and rainfall of 1600-2000 mm.


Must-read for coffee tasting-tongue taste map
The picture seen in a red wine lecture is now for everyone to actually feel. It can explain why the first taste of wine rolls in the mouth and why the coffee cup test takes a big sip. Let's understand it together. Remember: before the sweet and the bitter side of the acid-base.

Colorful map coffee table stands out among similar products
This series of brightly colored coffee tables are designed by Venetian designers. The top of each table has different lines, with maps of Paris, Barcelona, Venice and Istanbul. Coupled with red, yellow, brown and white four representative colors of each city, this series of coffee tables will easily stand out from similar products, unforgettable.